top of page
_edited.jpg)
Boston University
ENHANCED RUNNING PERFORMANCE
LATTICE MIDSOLE DESIGN


Department of Engineering
Senior Capstone Project
COULD ADDITIVE DESIGN SERVE AS A NEW BRIDGE
BETWEEN CURRENT STANDARDS AND
A BREAKTHROUGH IN MARATHON PERFORMANCE?
2018-2019
INSPIRATION
Personal Marathon Journey
Industry Pioneers
Senior Capstone Project




Introduction to
running footwear innovation
Deeper understanding of
Running Biomechanics & Performance Variables


Inception of additive midsoles
to running footwear


Capacity for advancement is
expanded with greater fluidity
in midsole arrangement


Diverted from listed projects to draft our own research proposal
Granted approval and FormLabs SLA Printer by the department

Current Limitations

In the past 15 years,
only a 2% improvement
in marathon performance
Sub-2 hour time deemed IMPOSSIBLE
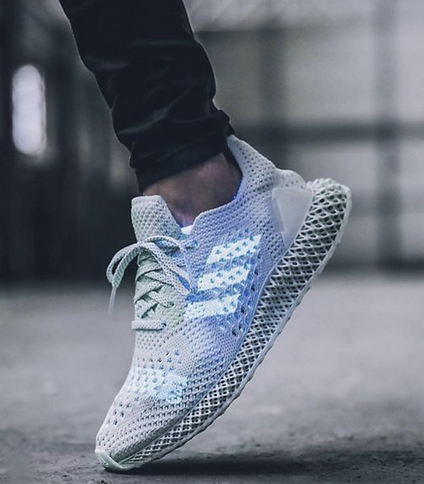
Existing 3D-midsoles designed
for general functionality
No literature on testing towards enhanced performance

Traditional injection molding
lacks the design variability
inherent to additive techniques
The Approach
GANTT CHART: DESIGN OPTIMIZATION SCHEDULE

AIMS
1
Evaluate FormLabs Materials
for foam-like elasticity
Design lattice structures of
varying form and structure
2
Test the resulting mechanical properties of each prototype
3
Using energy return as the
main performance parameter,
can 3D-structures compete
with that of conventional foam?
Energy Return
% ENERGY RETURN =
[ ENERGY RETURNED (J) /
TOTAL ENERGY STORED (J) ] * 100
Energy return allows greater utilization of
energy per stride, while reducing muscular force
Three main physiological parameters to sustain a high running velocity:


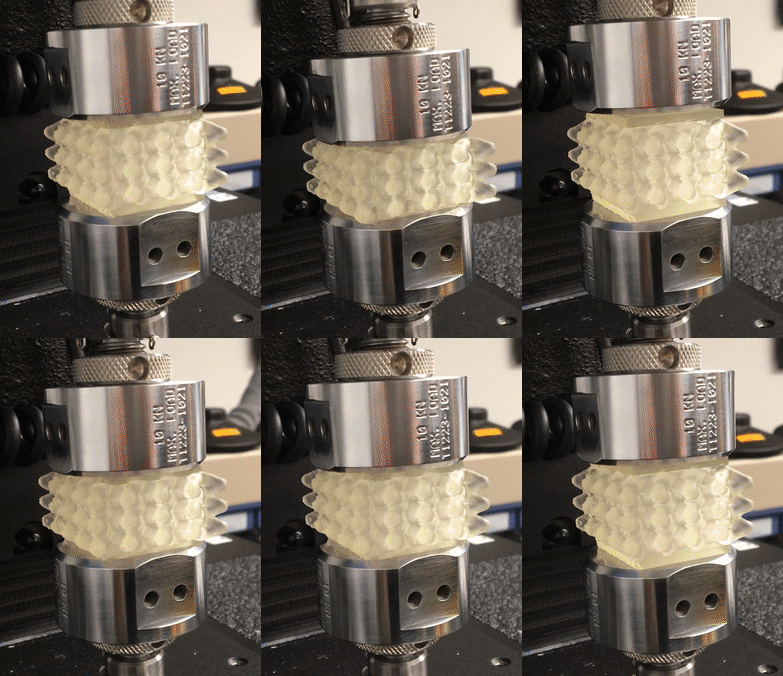
Principle constraints:
Load Range: 1.5- 2.0kN
Max Deformation: 12mm


VO2 MAX
LACTATE
THRESHOLD
Similar Among
Elite Athletes
RUNNING
ECONOMY
Average force of landing while running
Based on the behavior of the Nike ZoomX Prototype
Influenced, in part, by the running shoe itself
Lattice Structures


Distribute energy more evenly and at a slower rate, allowing greater stability
and lower impact
PERFORMANCE BENEFITS
The midsole's anatomy
can now be framed as
an empty SPACE of
infinite design FREEDOM
ALTERED VARIABLES

HEIGHT
ARRANGEMENT

BASE GEOMETRY
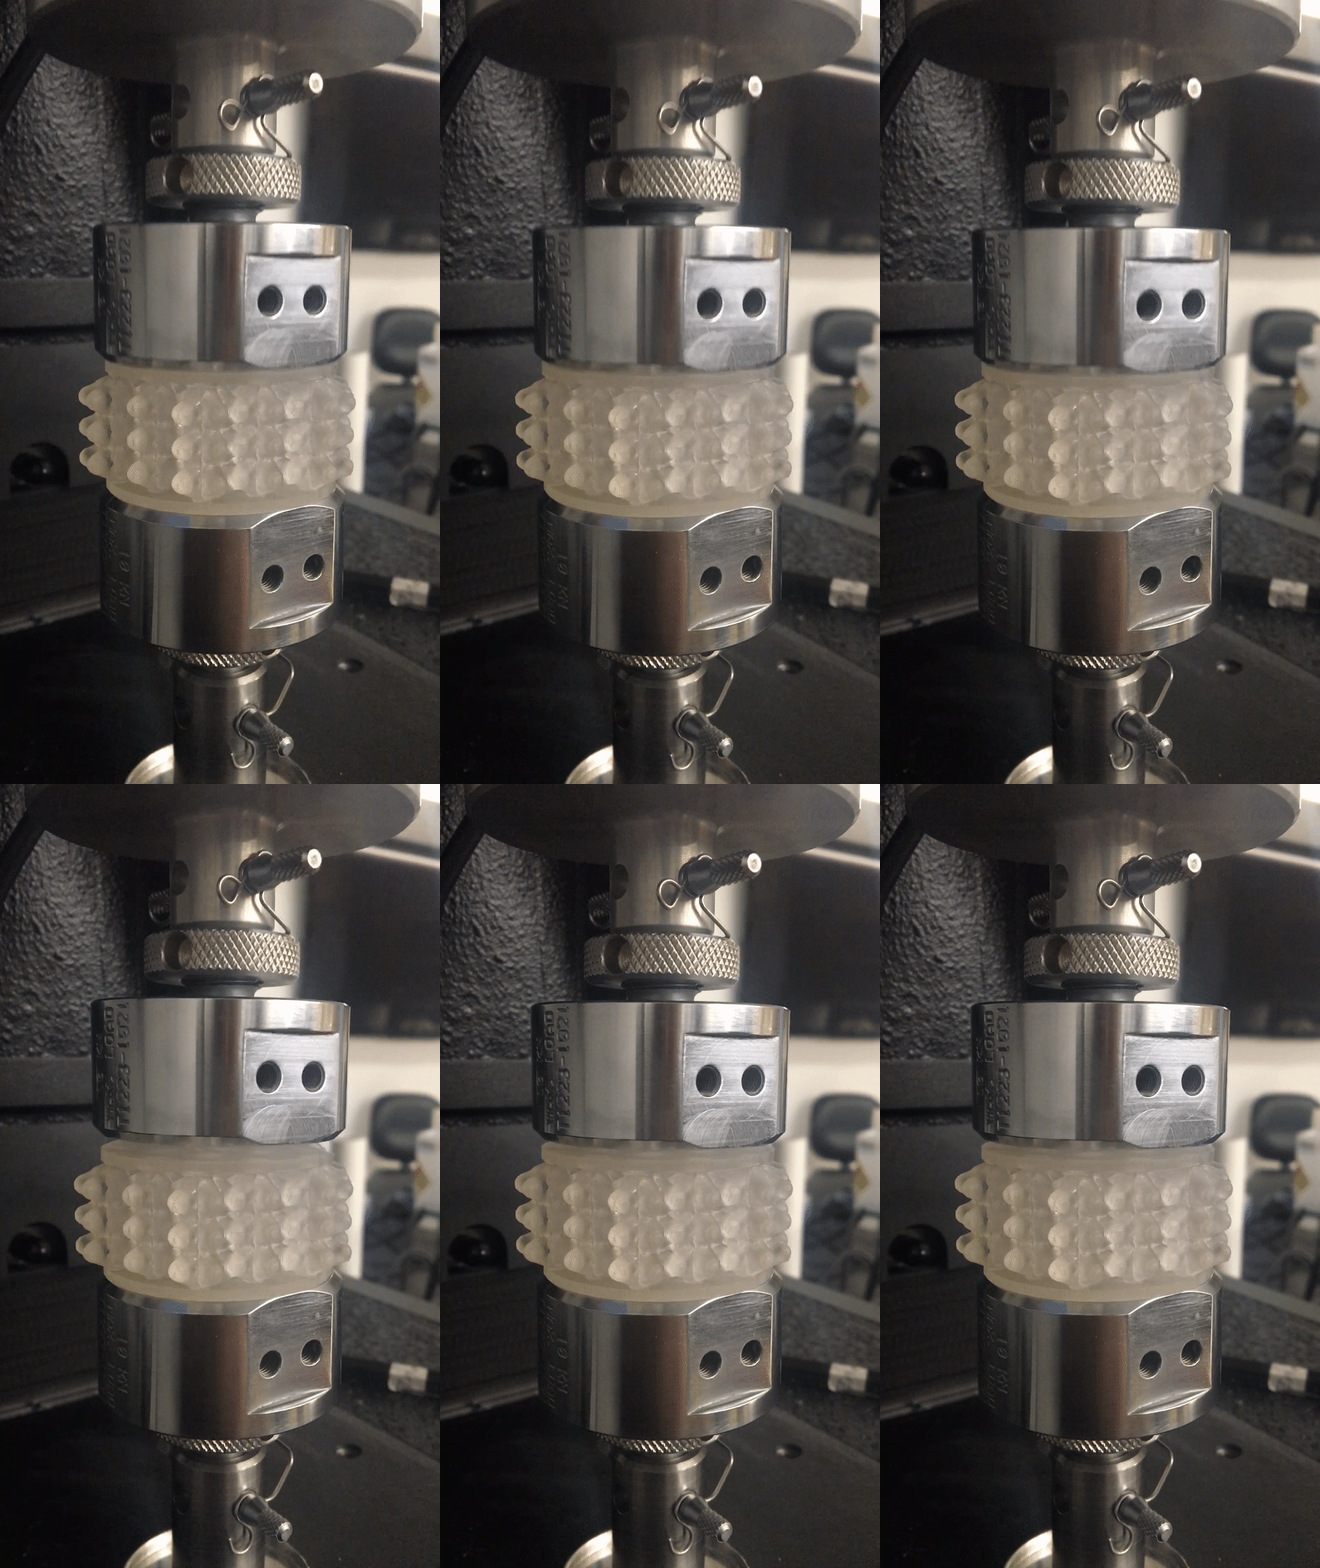

BOUNDING BOX
BEAM
THICKNESS
RULE SCALE
Phase 1: Weak Start
Preliminary test prints: fragile and soft
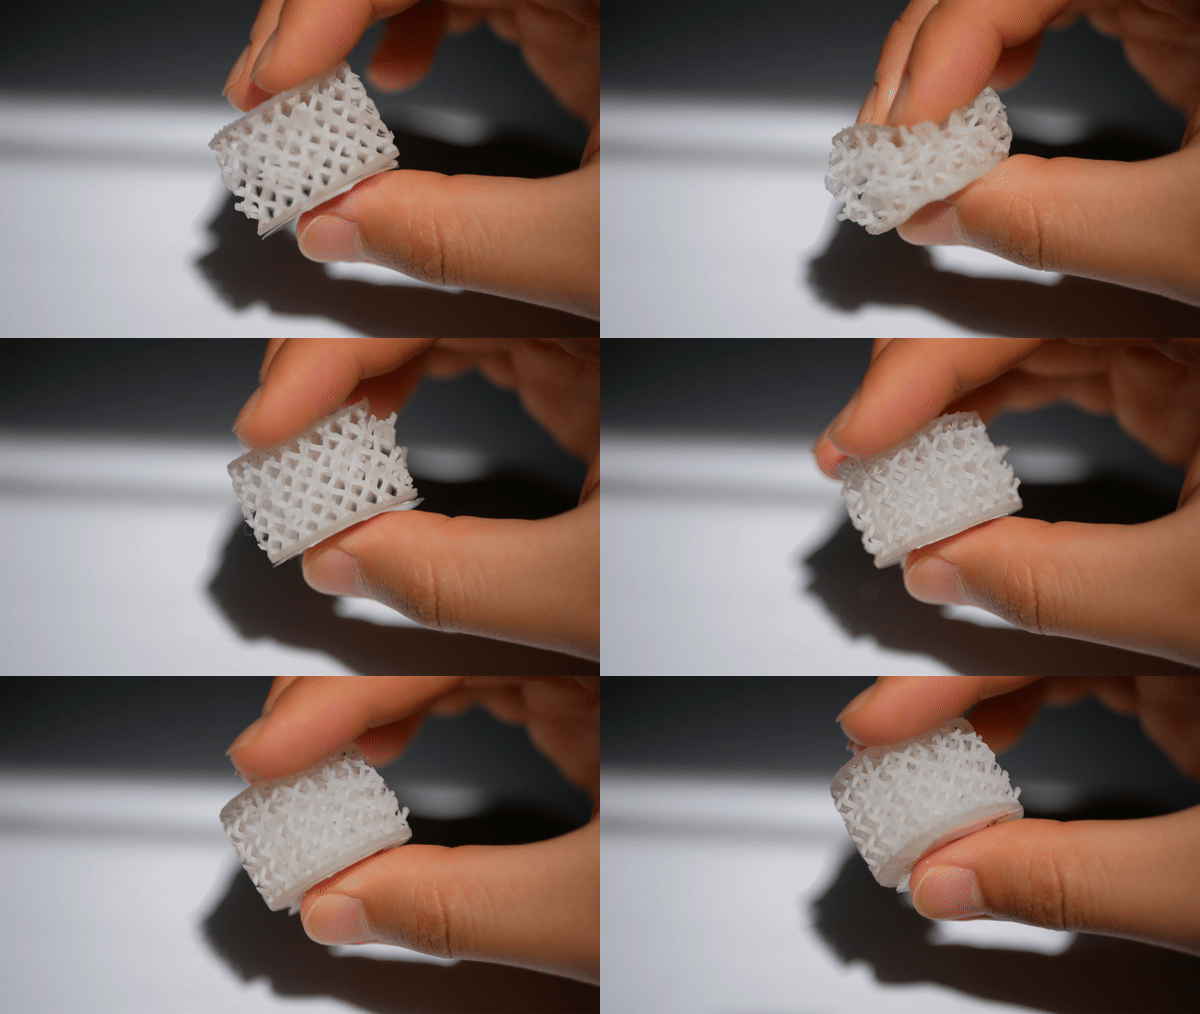
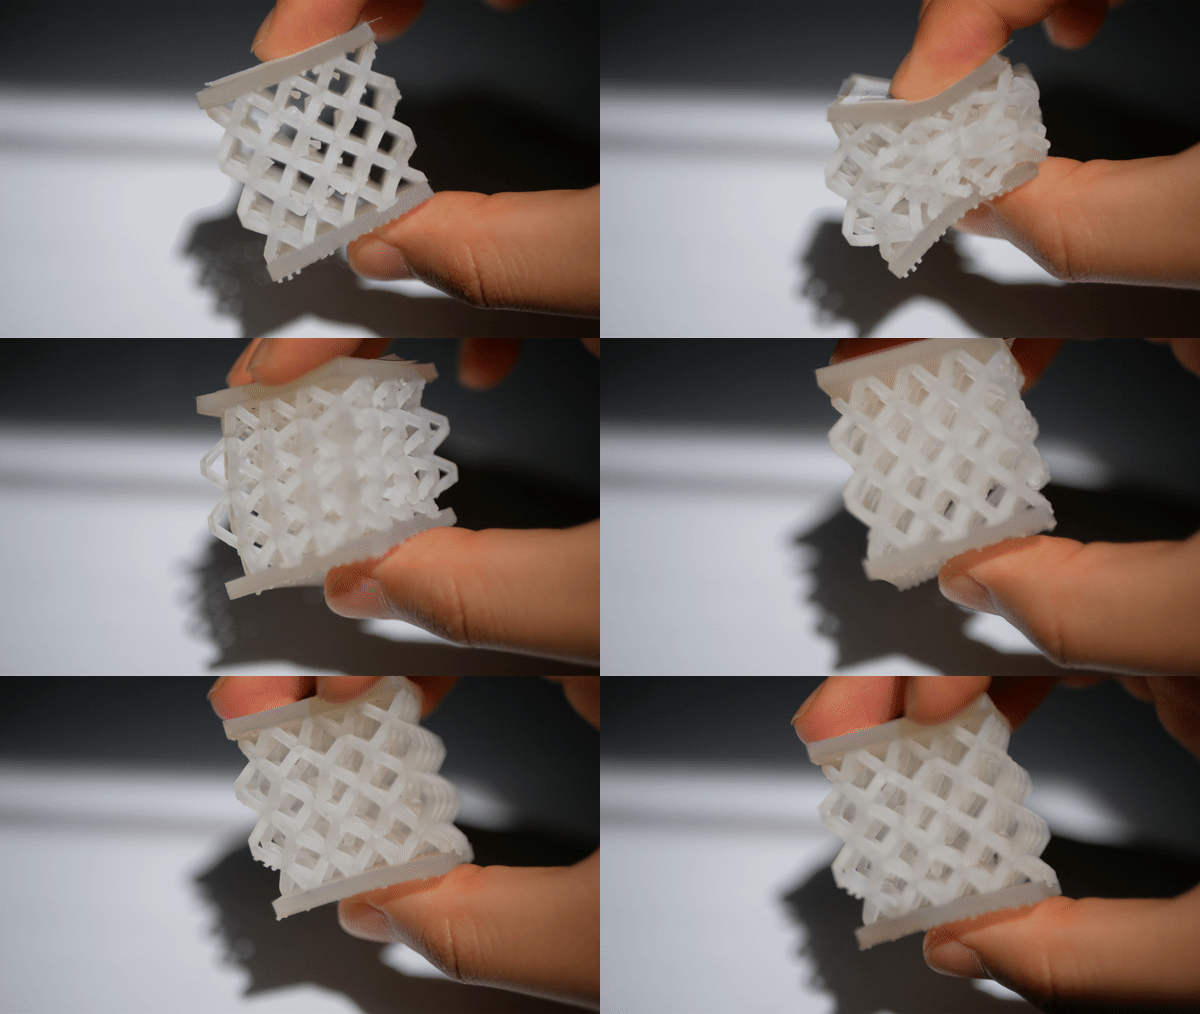

Initial models broke or passed max deformation
before reaching minimum load of 1.5kn
OPTIMIZATION: BEAM THICKNESS

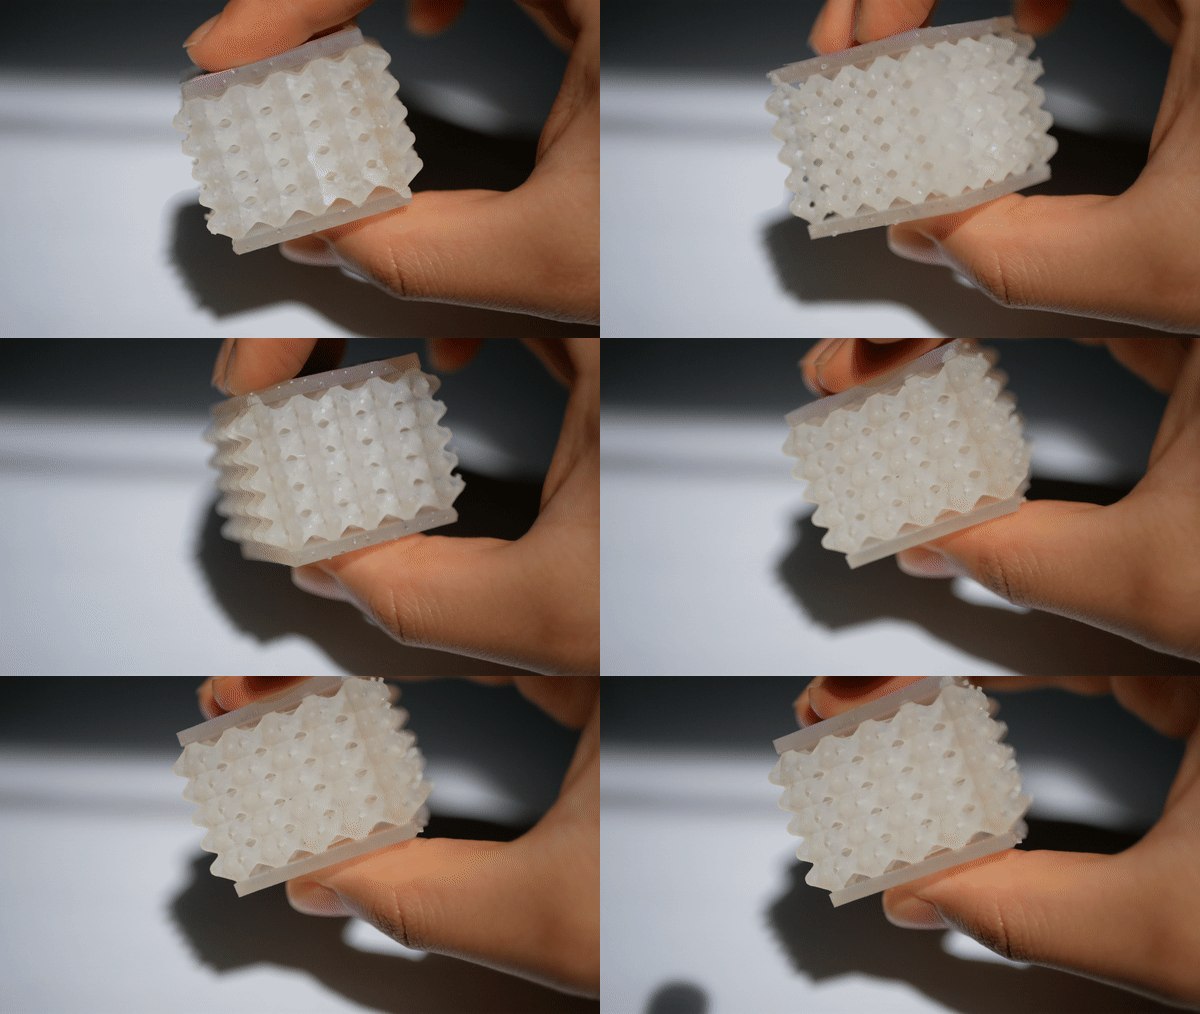
P1
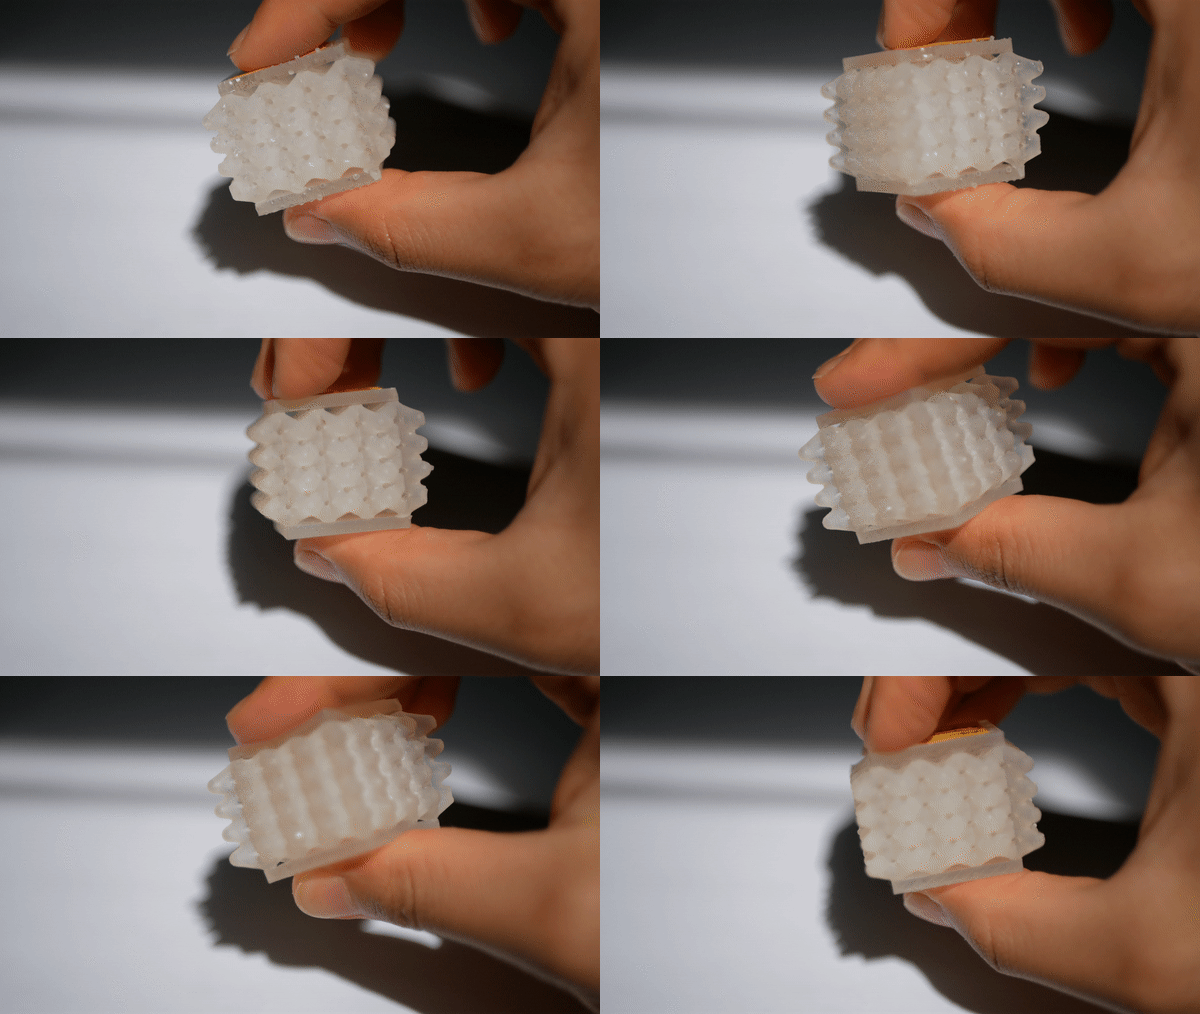
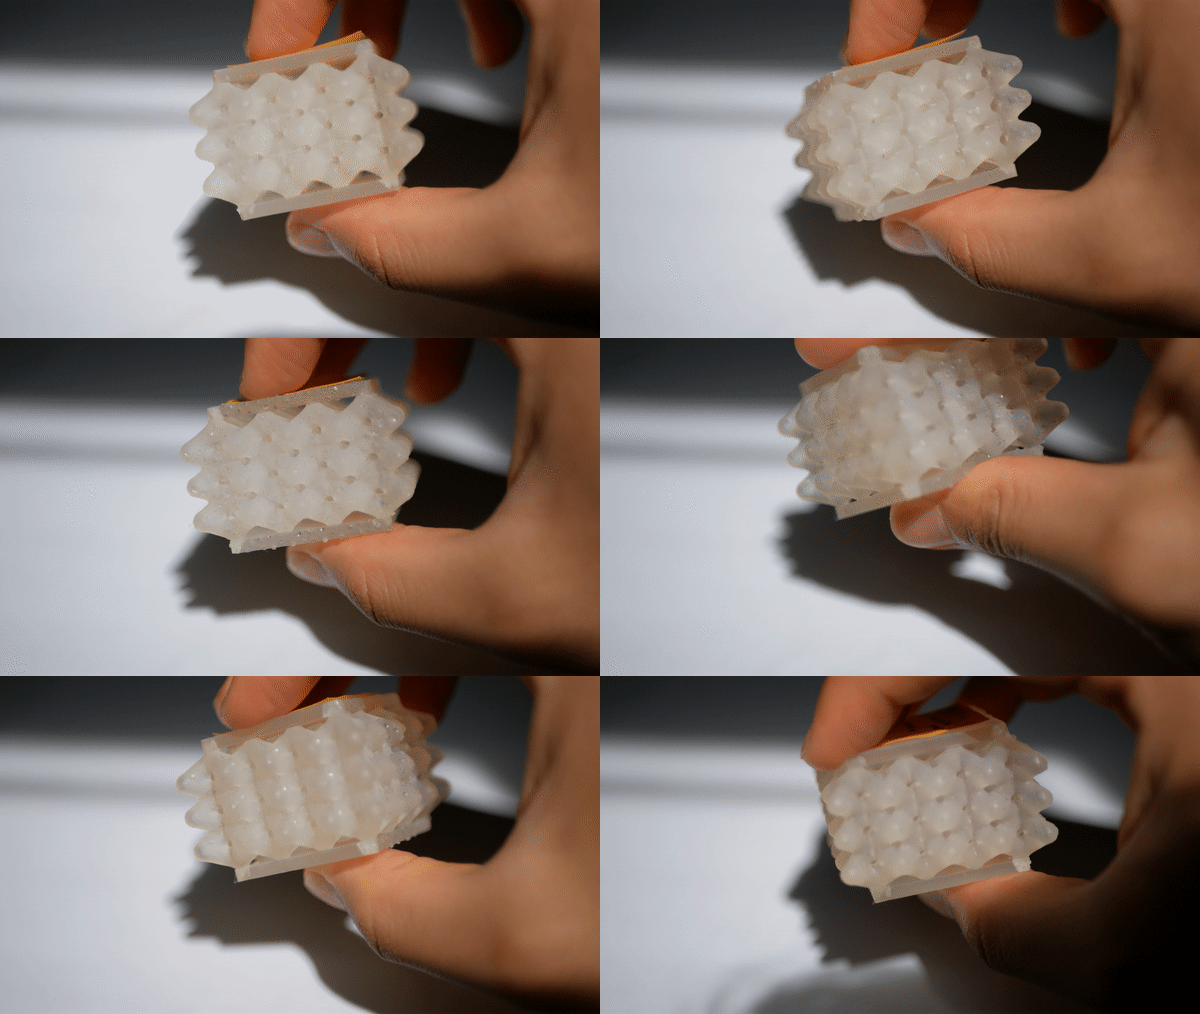
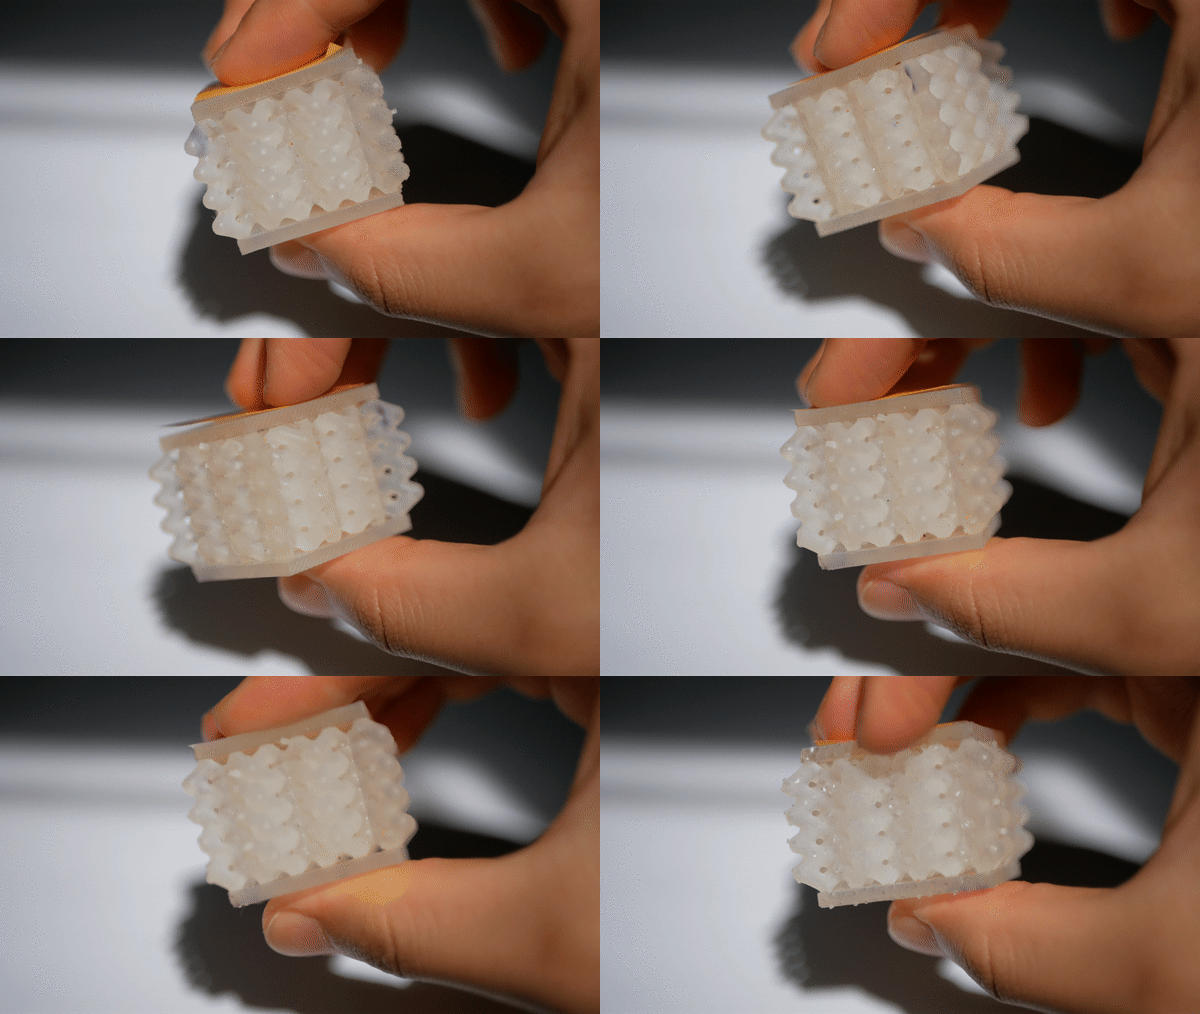
P3
P2
P4
Stage 1: 2.5mm Too weak
Stage 2: 3-4mm Improvement but
still insufficient
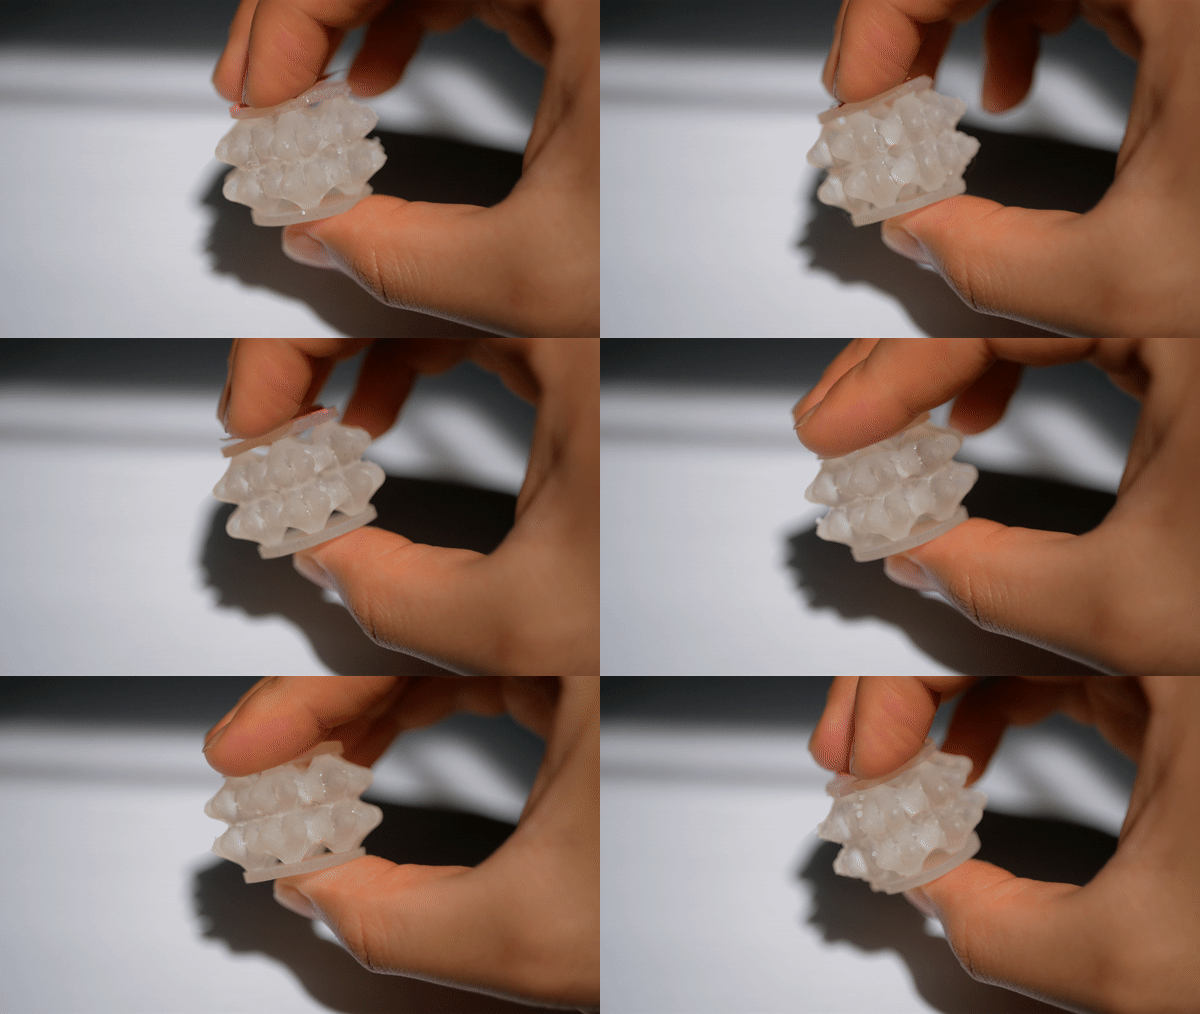
OPTIMIZATION: ARRANGEMENT
Stage 1
Stage 2

Side-directed beams
Corner-directed beams


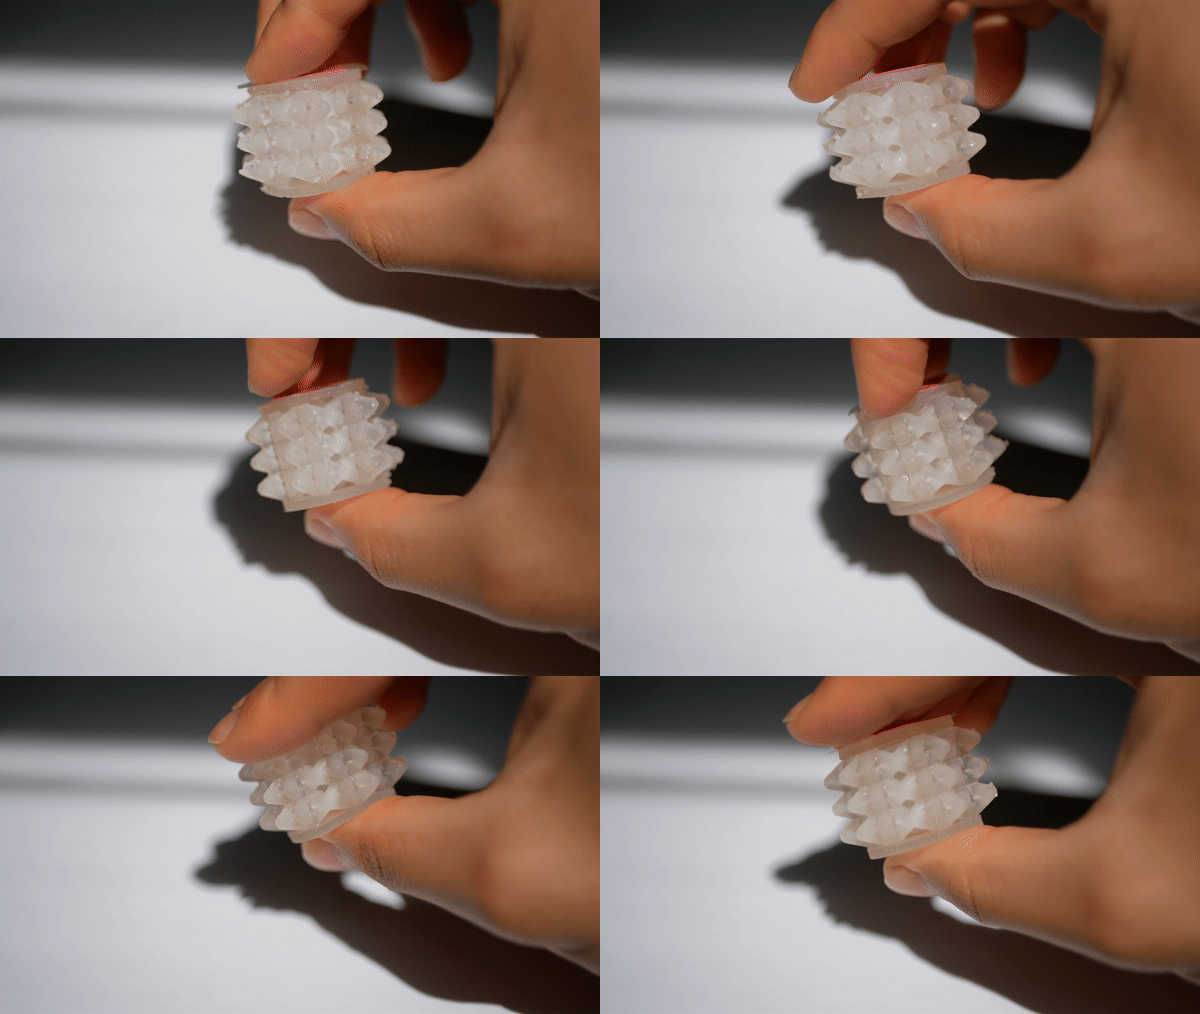
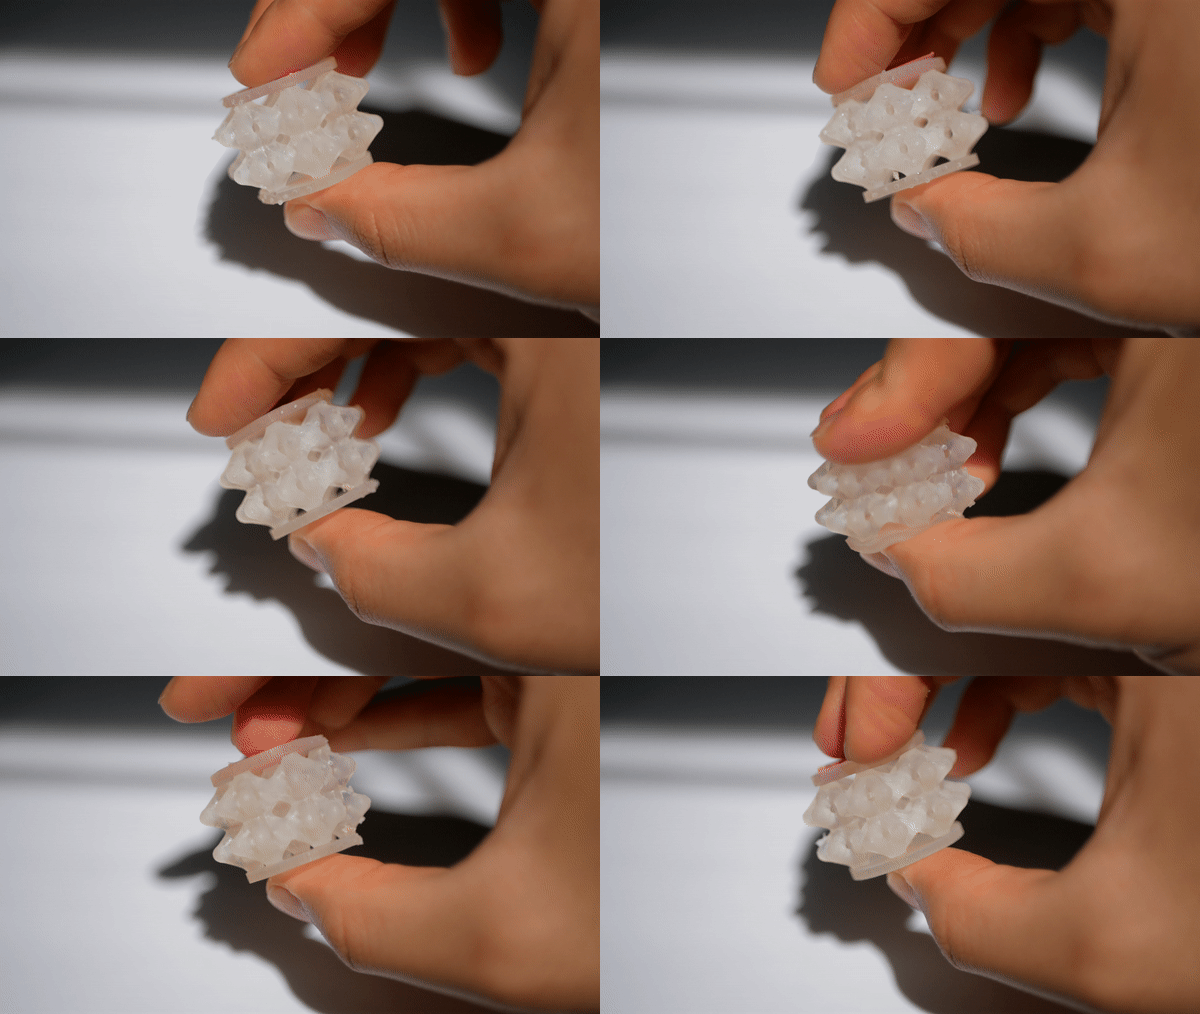
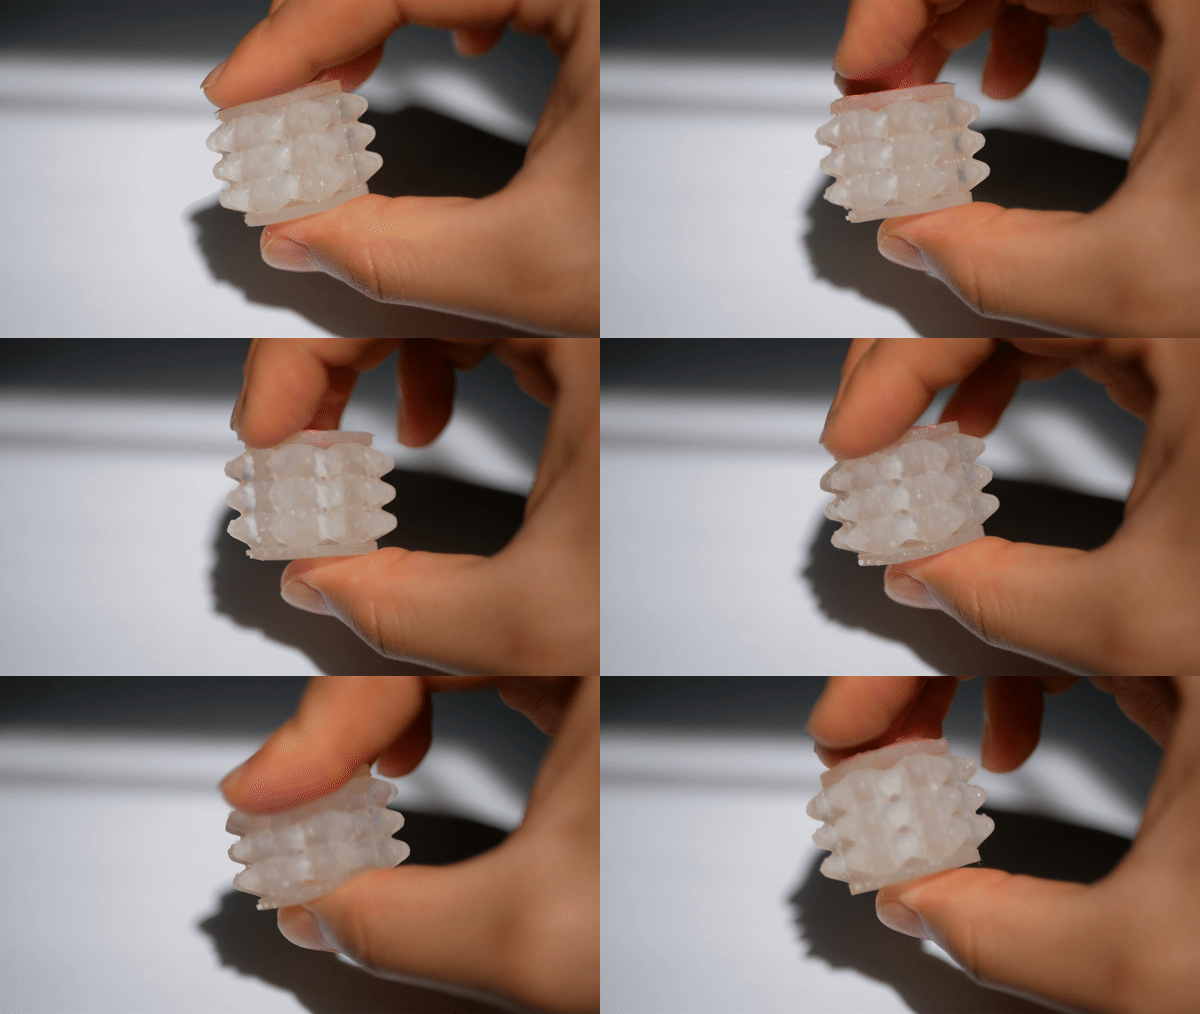
Phase 2: HEXAGON bounding box
GREATER STRENGTH IS FOUND IN NEW BASE GEOMETRY
yet it remains insufficient
OPTIMIZATION: BASE GEOMETRY
Stage 3: Hexagon-based Higher strength
bounding box but printed too small


P5
P6
P7
P8
P9
P10

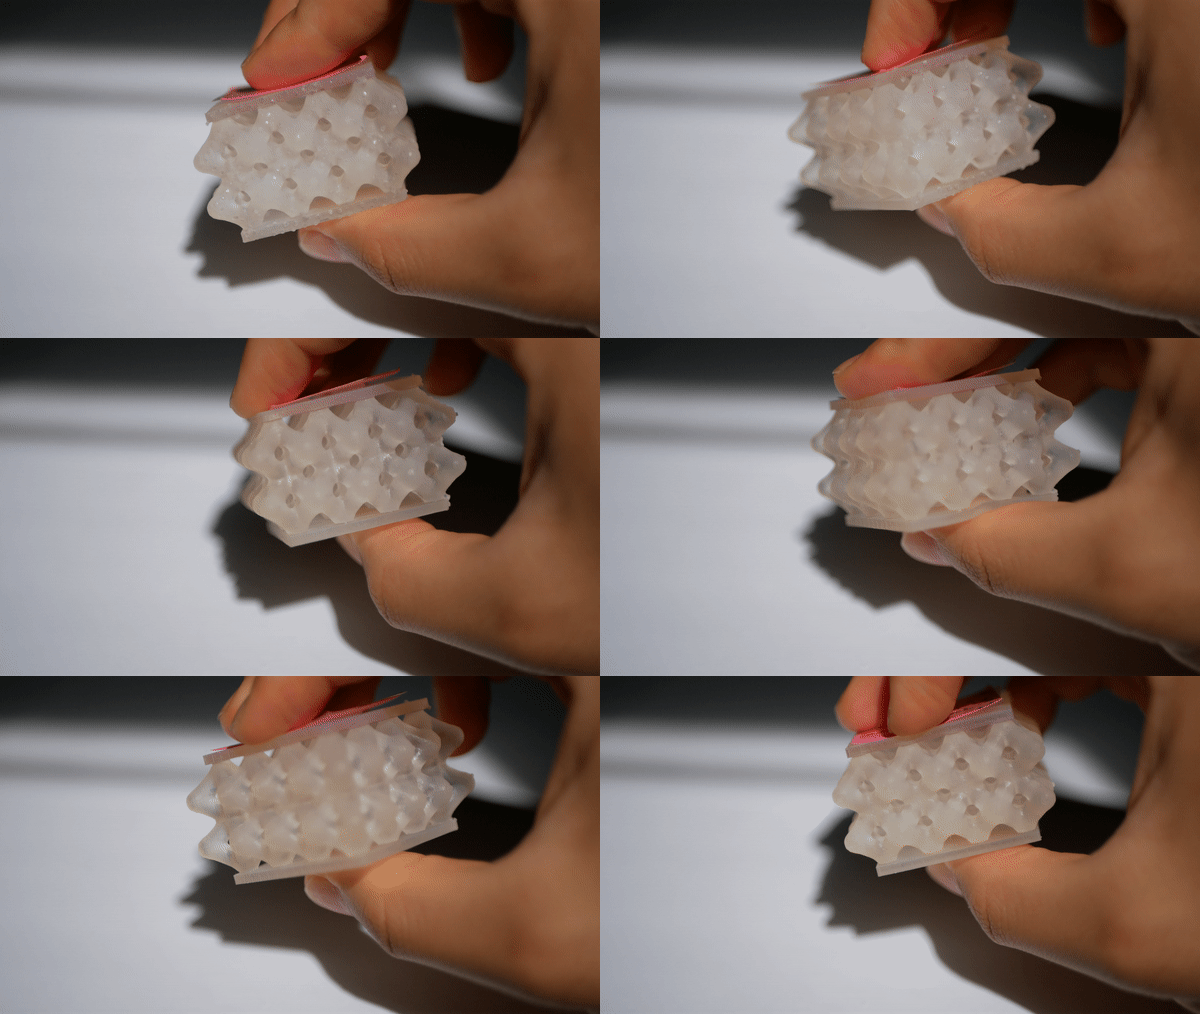
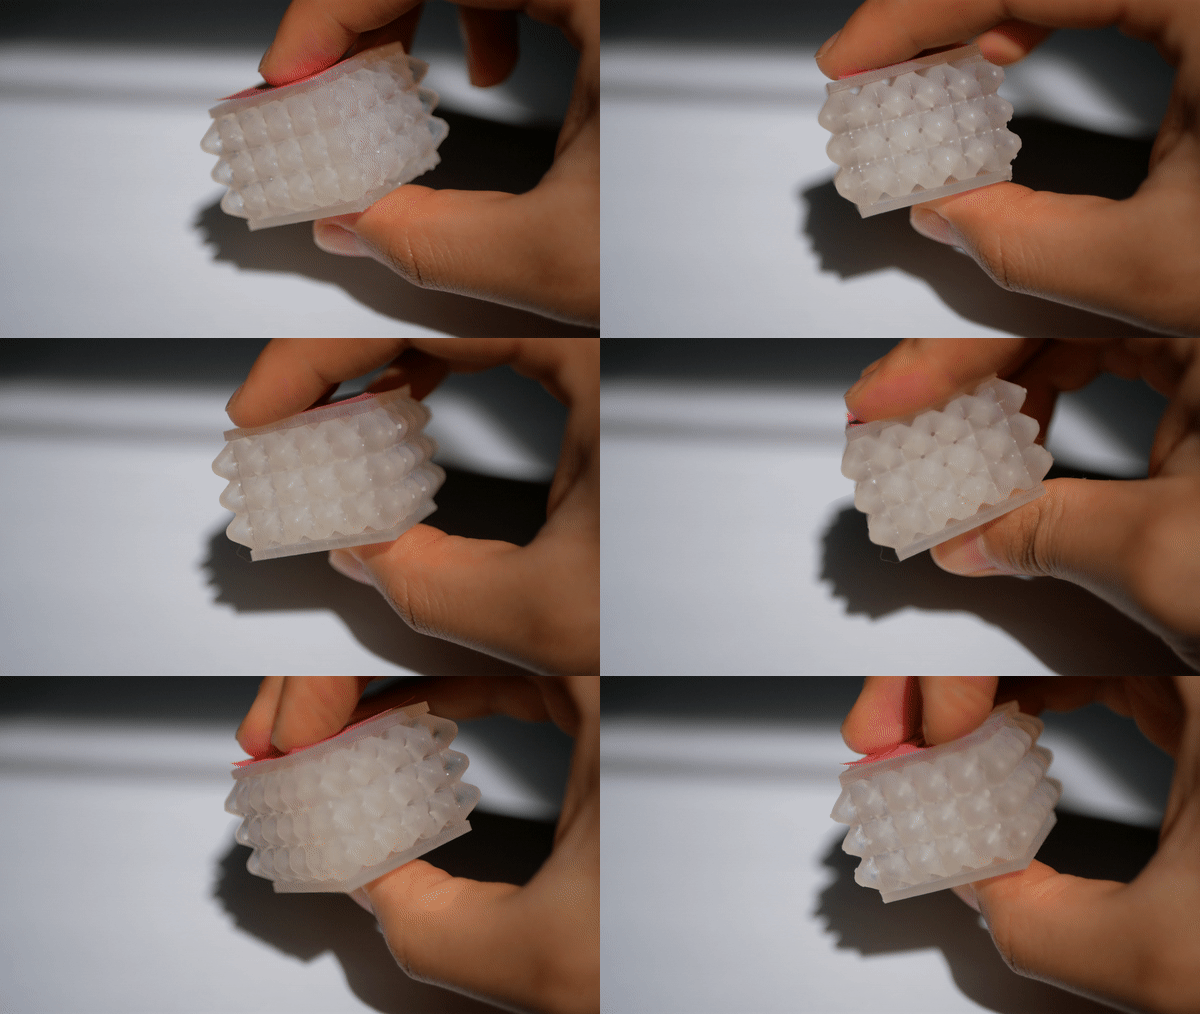
Phase 3: thickness gradient
anisotropic beam thickness distribution showcase high energy return and re-scaled models are first to surpass minimum required load
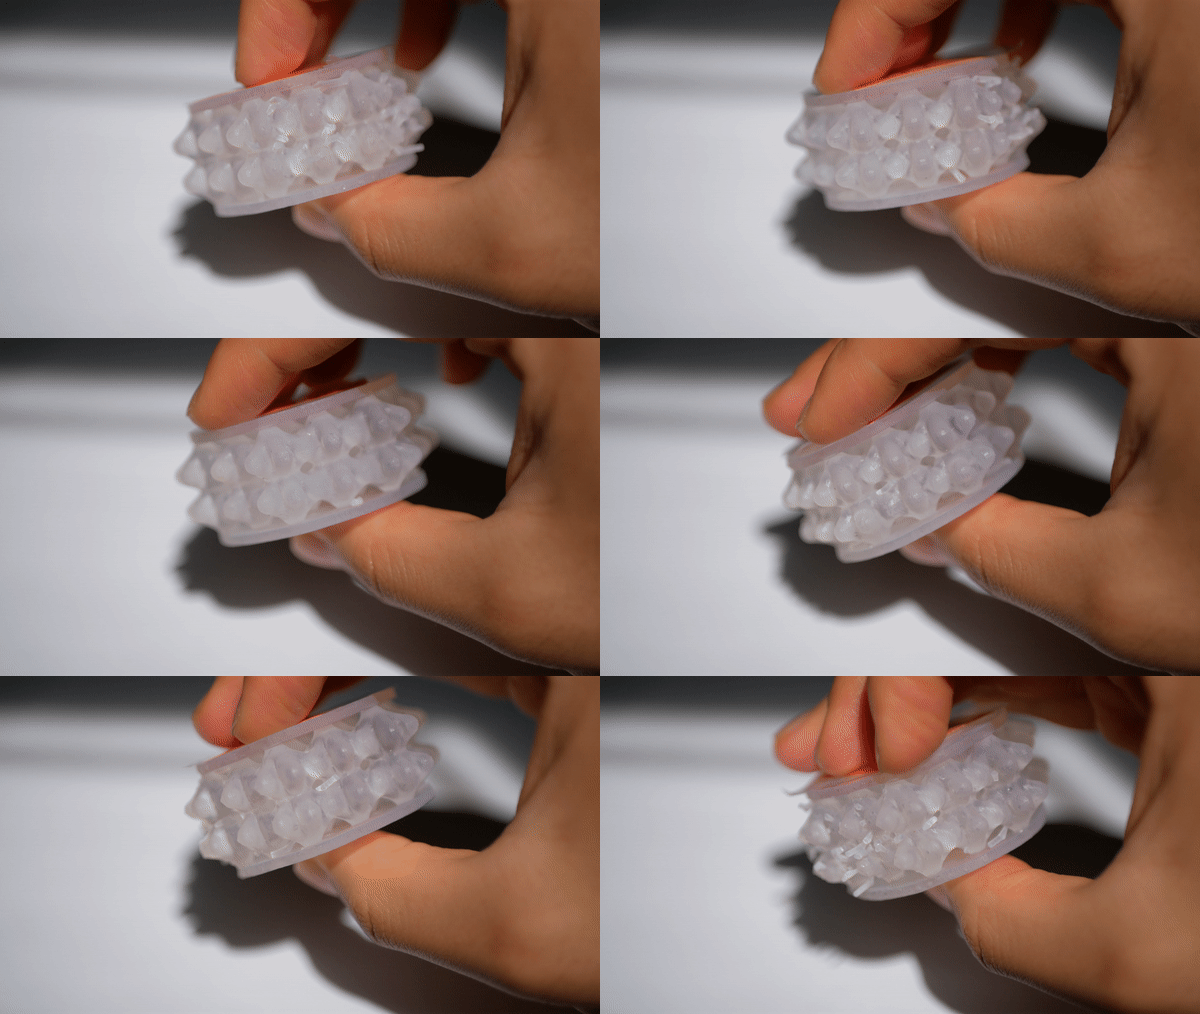
Stage 4:
Scaled P6,P8,P9 models (P11,P12,P13) were the
first to surpassed minimum peak force
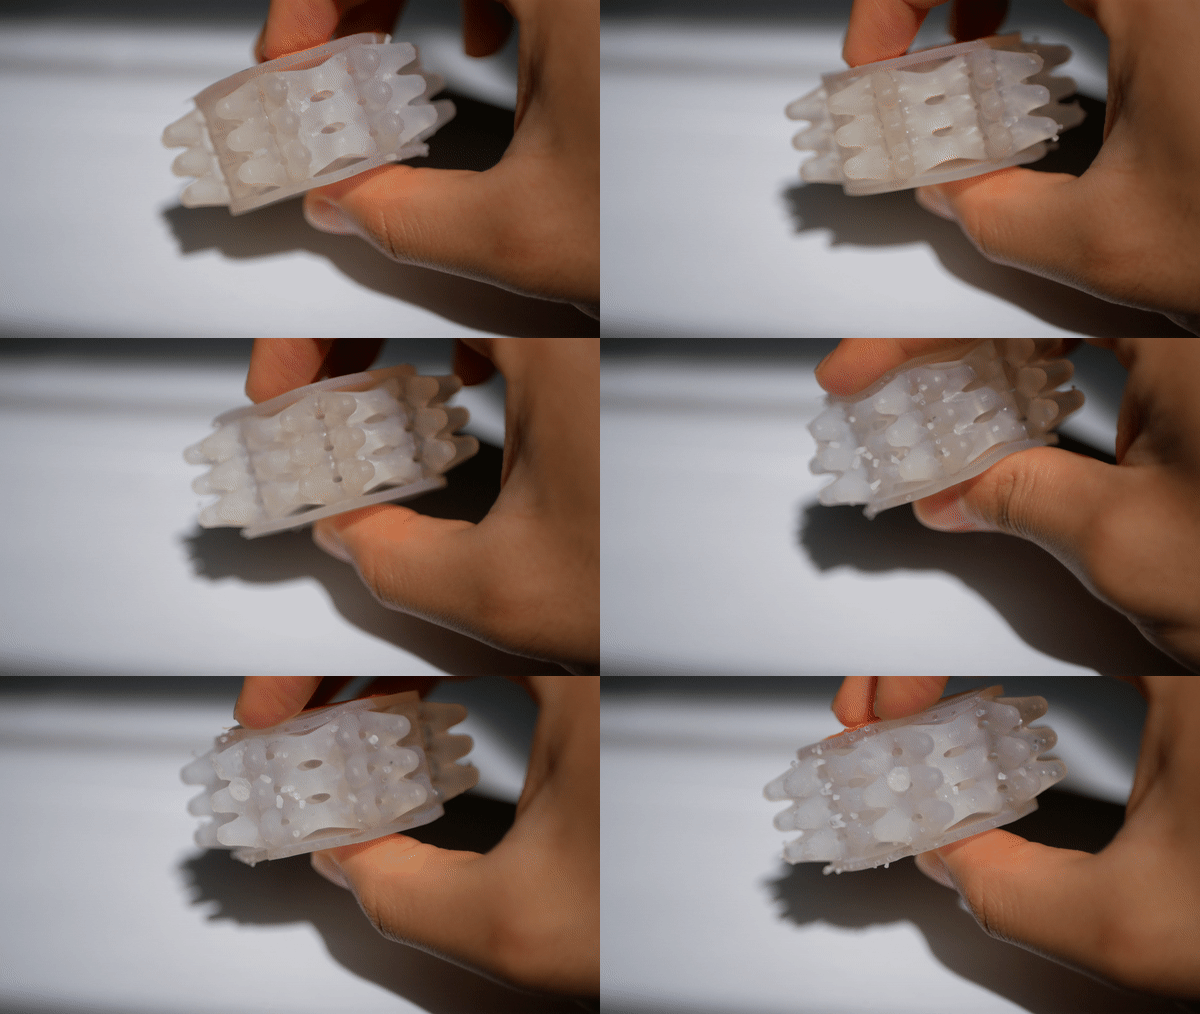
P11

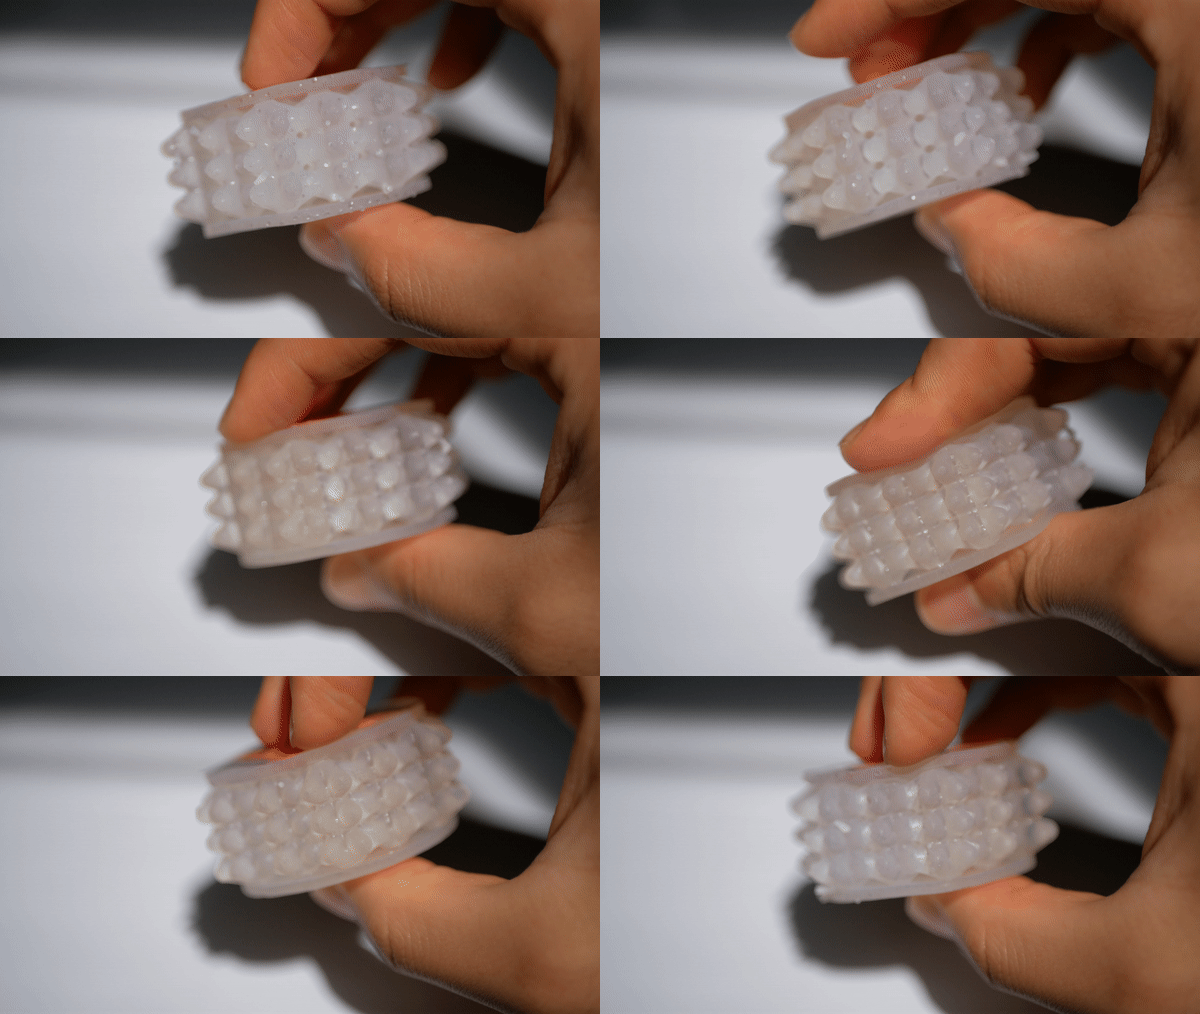
P13
P16
P12
OPTIMIZATION: GRADIENT
Stage 4: (P14, P15)
Gradual increase of distributed thickness
thought to dampen strike and support durability
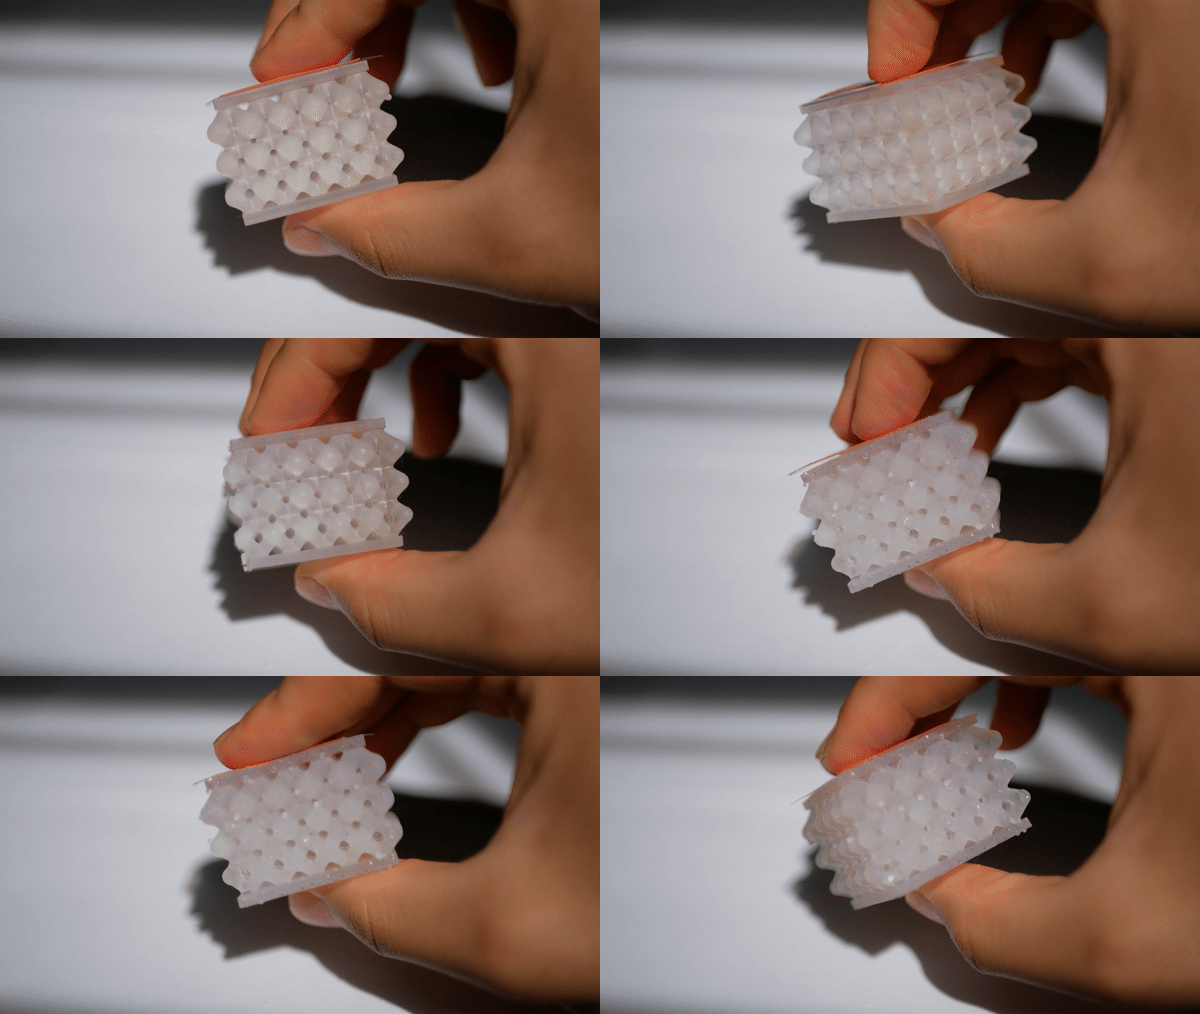
P14

P15


Models were too weak but displayed the best energy return
out of all prototypes

Phase 4: peak performance
best performing models were found in the
final phase through a balance of variables
OPTIMIZATION: BEAM THICKNESS & RULE SCALE
Stage 5:
Holding all variables of P11 constant except for its beam thickness (3.5mm), P17 & P18 were changed to 3mm and 3.25 mm, respectively
Energy return increased from 72.5% (P11) to
80% (P17) and 81.3% (P18)
PROTOTYPE 18 was ~6% less than the
NIKE ZOOMX PROTOTYPE within the same constraints

As shown in the last two prototypes, there exists a transition point in which higher rule scale (unit cell size) and thickness actually causes adverse effects on energy return
BEST PERFORMING PROTOTYPE: P18
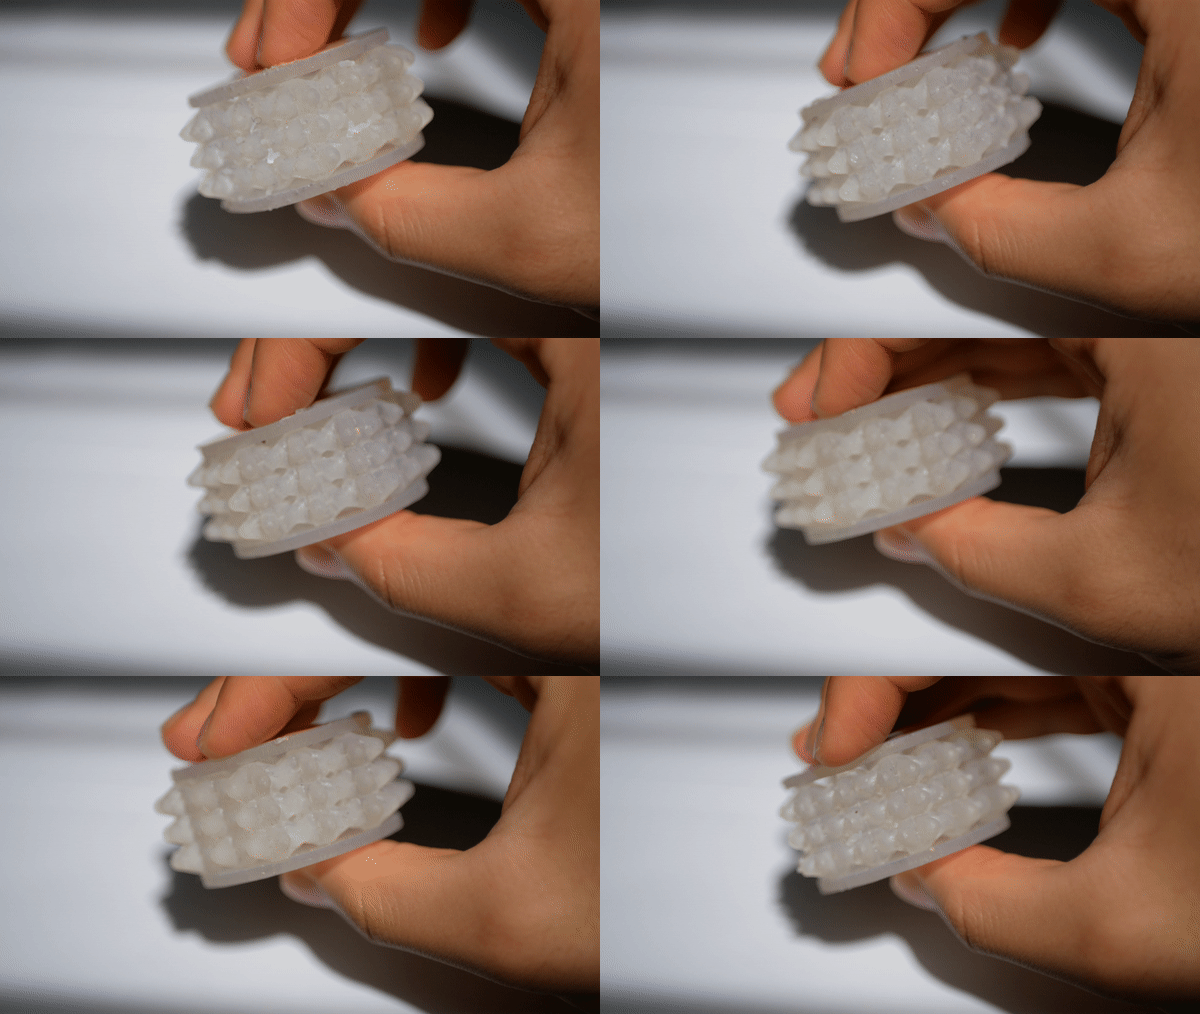


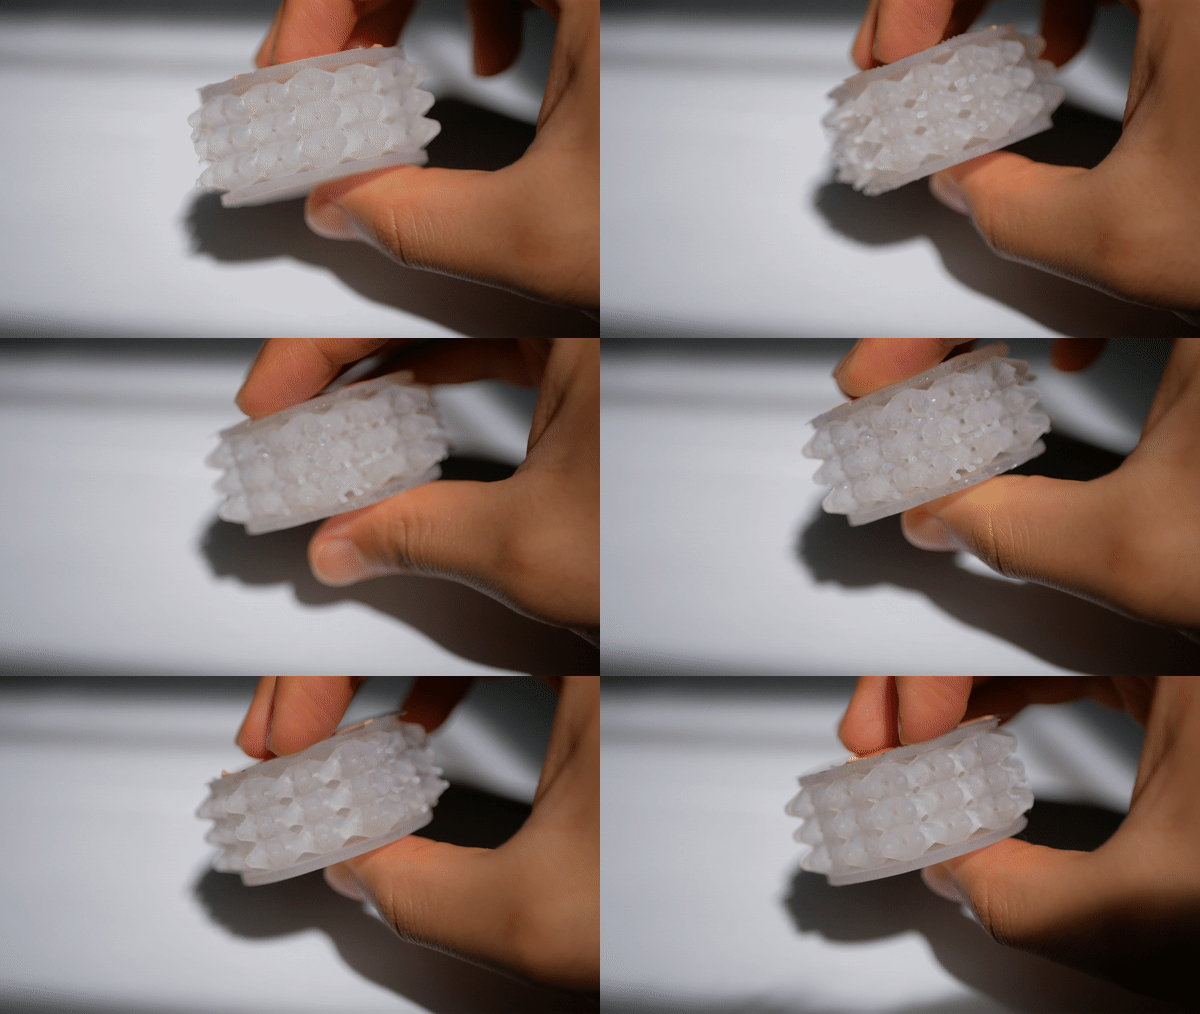

P20
P17

P19

Phase 5: FULL MIDSOLE & NEXT STEPS

THE BEST PERFORMING PROTOTYPE WAS USED
TO GENERATE A FULL MIDSOLE MODEL
Constructed in halves due to build size limitations of the printer
Resulting midsole was too dense and
heavy due to faulty distribution of the lattice structure


Moving forward, improvement lies in further exploring anisotropic arrangements and preserving the tested qualities shown advantageous to energy return,
without compensating a lightweight model

bottom of page